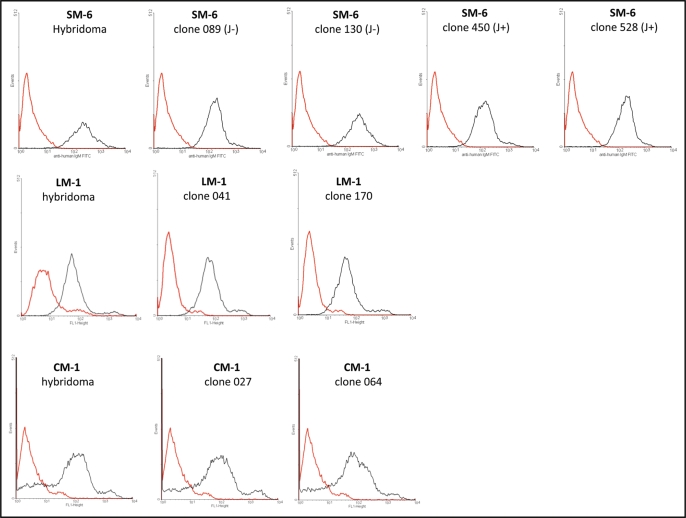
Figure 7.
FACS analysis of hybridoma and PER.C6® derived IgM antibodies on tumor cells. Top: FACS analysis of SM-6 antibody binding to tumor cell line BXPC-3. Positive control SM-6 antibody (black line, 100 µg/mL) is hybridoma produced IgM. CP IgM (Chrompure; red line 100 µg/mL) was used as a negative control. PER.C6® SM-6 (J−) clones 089 and 130, and SM-6 (J+) clones 450 and 528 were tested (black line, 100 µg/mL). Middle: FACS analysis of LM-1 antibody binding to the BXPC-3 cell line. Positive control LM-1 (black line, 100 µg/mL) is hybridoma produced IgM. Negative control is CP IgM (Chrompure; red line 100 µg/mL). PER.C6® LM-1 clones 041 and 170 were tested (black line, 100 µg/mL). Bottom: FACS analysis of CM-1 antibody to the tumor cell line A549. Positive control CM-1 (black line, 100 µg/mL) is hybridoma produced IgM. Negative control is CP IgM (Chrompure; red line 100 µg/mL). PER.C6® CM-1 clones 027 and 064 were tested (100 µg/mL).

