Figure 5.

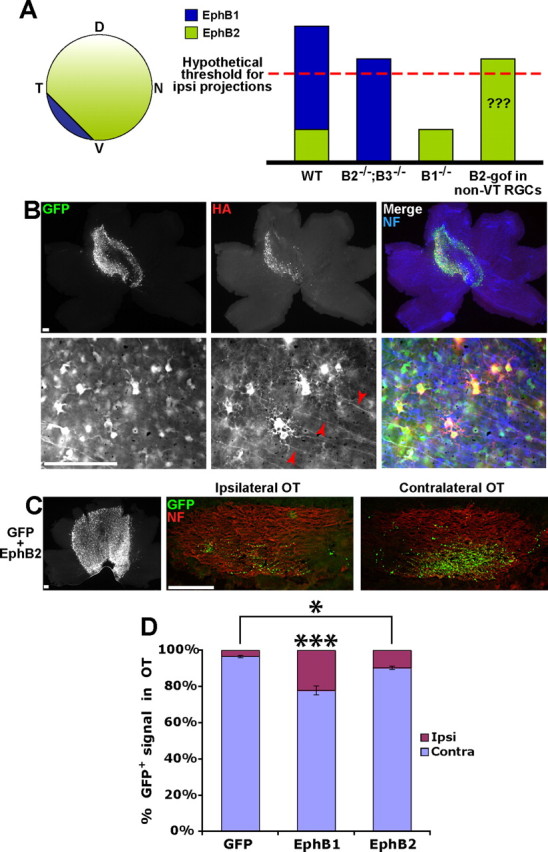
EphB1 induces a greater proportion of GFP+ ipsilateral projections compared with EphB2. A, Diagram depicting expression patterns of EphB1 and EphB2 in the embryonic mouse retina. The graph represents a scenario, consistent with current data from EphB knock-out mice, in which the total expression level of EphB receptors exceeds a hypothetical threshold and drives the ipsilateral (ipsi) projection, rather than the specificity of EphB1. We tested whether ectopic expression of EphB2 in RGCs [EphB2 gain of function (B2-gof); right column] supports the validity of this model. WT, Wild type; D, dorsal; T, temporal; N, nasal; V, ventral. B, Low-power and high-power images of E18.5 retina electroporated with GFP plus EphB2 at E14.5. Of note, HA expression is visible on intraretinal RGC axons electroporated with EphB2 (red arrowheads), but HA was rarely observed in EphB1+ axons (Fig. 2A). C, Representative example of retina and OTs electroporated with GFP plus EphB2. NF, Neurofilament. D, EphB1 is significantly more efficient at directing ipsilateral (Ipsi) projections compared with EphB2 (22 vs 10%), but EphB2 does induce a greater percentage of uncrossed projections compared with GFP alone (10 vs 3%). n ≥ 13 embryos for each condition, from three or more separate electroporation experiments. Contra, Contralateral. Data represent mean ± SEM. Scale bars, 100 μm. ANOVA: F(2,41) = 31.52, p < 0.0001; modified t tests: **p < 0.05, ***p < 0.0001.
