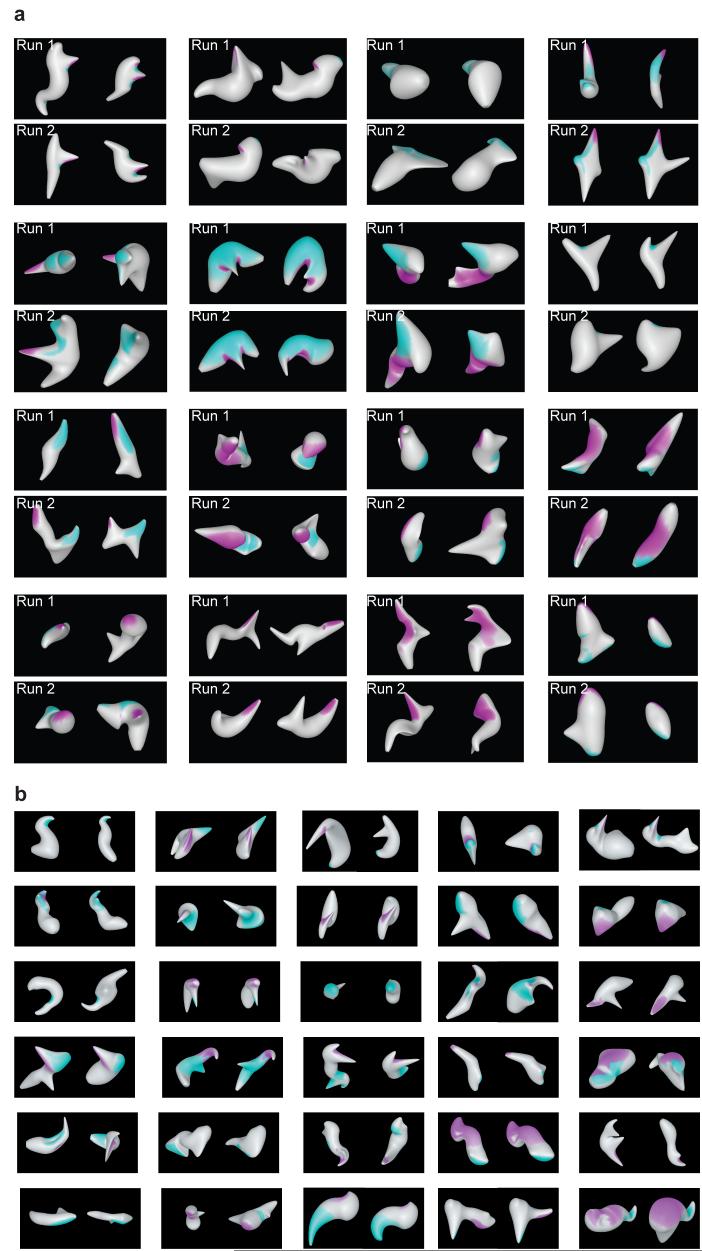
Figure 4. 3D surface configuration tuning patterns.
(a) All neurons for which two independent evolutionary stimulus lineages were obtained. In each case, two high response stimuli are shown from the first run (top row) and the second run (bottom row). Best fit 2-component models are projected onto these stimuli as in Fig. 1e. (b) Example neurons for which only one lineage was obtained. In each case, two high response stimuli are shown with the best fit model projected onto the surface.

