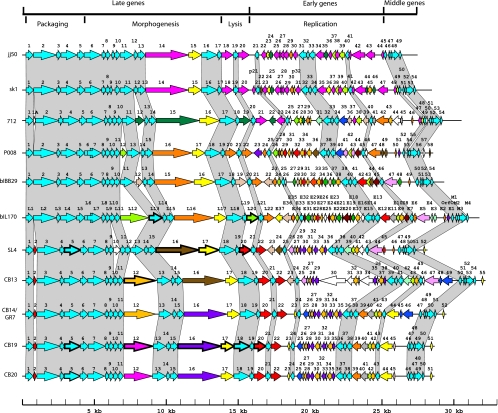
FIG. 1.
Schematic representation of the genomic organization of phages belonging to the 936 group. Each line represents a different phage genome and each arrow represents a putative protein. Each genome was compared only with the successive genome in this figure. ORFs of the same color represent those that share more than 80% amino acid identity. The percentages have been calculated for the smallest proteins. The white ORFs are unique. Gray shading connects genome regions conserved in all phages. Finally, arrows with thick outlines represent structural proteins observed on SDS-PAGE gels and identified by MS or by N-terminal sequencing (for the protein identification of phage bIL170, see references 9 and 33).

