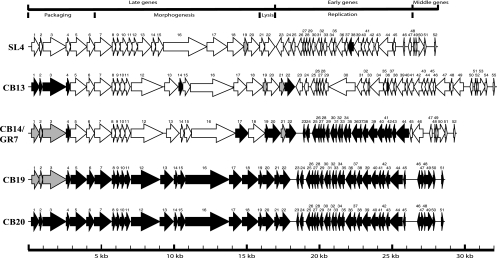
FIG. 2.
Schematic representation of the genomic organization of lactococcal phages SL4, CB13, CB14/GR7, CB19, and CB20. Each line represents a different phage genome, and each arrow represents a putative protein. The ORFs in black or gray represent those that share 100% amino acid identity. Arrows in white indicate proteins that share less than 100% amino acid identity.

