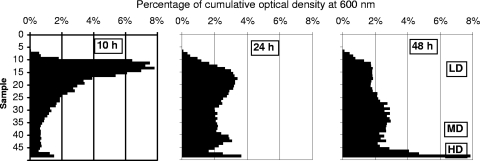
FIG. 1.
Distribution of the cells in a Radioselectan density gradient after ultracentrifugation of a 10-, 24-, or 48-h culture of S. Typhimurium. Fifty successive samples of 200 μl have been collected from the gradient from top to bottom of the ultracentrifuge tube. Bars represent the OD600s of the individual samples expressed as percentages of the cumulated OD600 of the 50 samples. In the graphs, cell density increases from their upper part to their lower part. LD, MD, and HD cell subpopulations are indicated.

