FIG. 3.
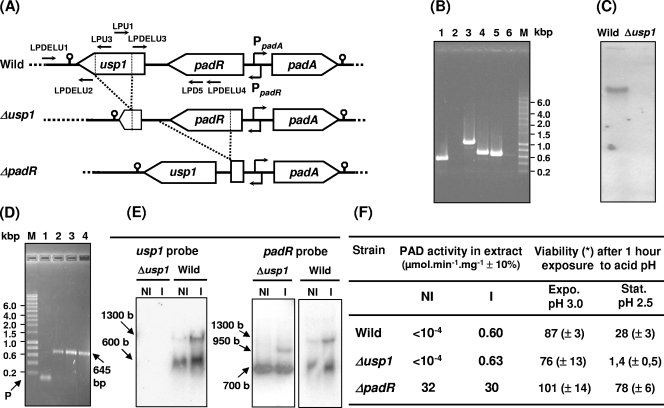
Genetic and phenotypic comparison of wild-type and mutant strains. (A) padA gene locus organization in the strains. PpadA and PpadR are the overlapping diverging promoters of padA and padR, respectively. Small horizontal arrows indicate primers for PCR amplification used in panels B, C, and D experiments. (B) Amplicon from chromosomal DNA of the usp1 region with three primer pairs (see panel A) on wild-type strain (lanes 1, 3, and 5) and Δusp1 mutant strain (lanes 2, 4, and 6). Lanes 1 and 2, amplicon with primers LPDELU1 and LPU3; lanes 3 and 4, amplicon with the primers LPDELU1 and LPD5; lanes 5 and 6, amplicon with the primers LPU1 and LPDELU4. (C) Southern blot with usp1 probe on digested DNA from wild-type and Δusp1 strains. (D) RT-PCR with the primers LPD5 and LPU1, which bind within the padR and the usp1 genes, respectively, and RNA extract from noninduced (lane 2) and p-coumaric acid-induced (lane 3) cultures of L. plantarum: lane 1, PCR control without the RT step to validate DNase treatment; lane 4, control PCR with DNA from L. plantarum; P, primer control (no amplification); lane M, molecular mass marker (Smart Ladder; Eurogentec). (E) Northern blot with total RNA from noninduced (NI) and 1.2 mM p-coumaric acid-induced (I) bacteria of Δusp1 mutant and wild-type strains. (F) Phenotypes of the strains: PAD activity in either noninduced (NI) and 1.2 mM p-coumaric acid, 10-min induced (I) strains and viability of cells from exponential (Expo.) or early stationary (Stat.) stage of growth after 1 h of exposure to pH 3.0 and 2.5. The results are an average of three independent experiments. Standard deviations are shown in parentheses.

