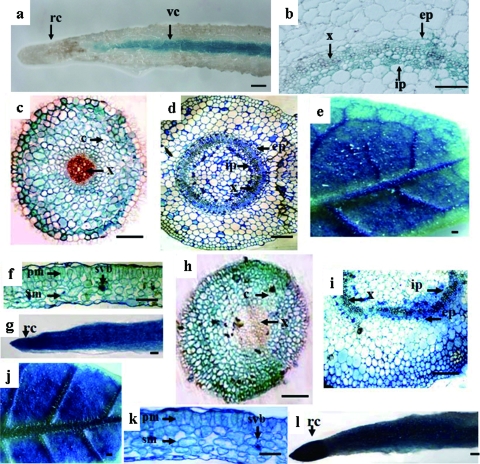
FIG. 6.
Histochemical localization of GUS expression patterns in pβC1 and pINT121 transgenic plants. Sections shown in panels a and b were from pINTβ3 transgenic plants showing TYLCCNV satellite promoter expression patterns. Sections shown in panels c, d, e, f, and g were from pβC1 transgenic plants. Sections shown in panels h, i, j, k, and l were from pINT121 transgenic plants. (a) Longitudinal root section; (b) transverse stem section; (c and h) transverse root section; (d and i) transverse stem section; (e and j) underside of leaves; (f and k) transverse leaf section; (g and l) longitudinal root section. c, cortex; ep, external phloem; ip, internal phloem; pm, palisade mesophyll; rc, root cap; sm, spongy mesophyll; svb, secondary vascular bundle; vc, vascular cylinder; x, xylem. Bars = 20 μm.

