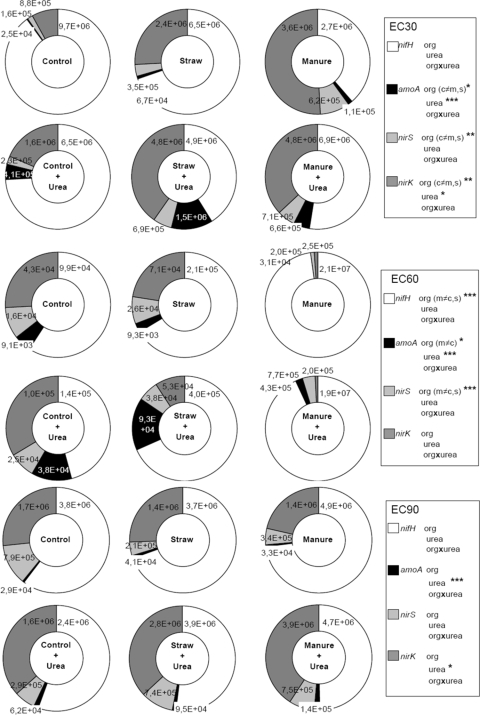
FIG. 2.
Effect of one particular fertilizing treatment on all bacterial populations measured in the present study (nifH, amoA [AOA and AOB], nirS, and nirK) at three different plant development stages (EC30, young leaf development; EC60, flowering; EC90, senescence). Significance (ANOVA): ***, P < 0.001; **, P < 0.001; *, P < 0.05. Abbreviations: org (organic) = manure + straw, m = manure, s = straw; e.g., c≠m = manure is significantly different from the control.

