
FIG. 1.
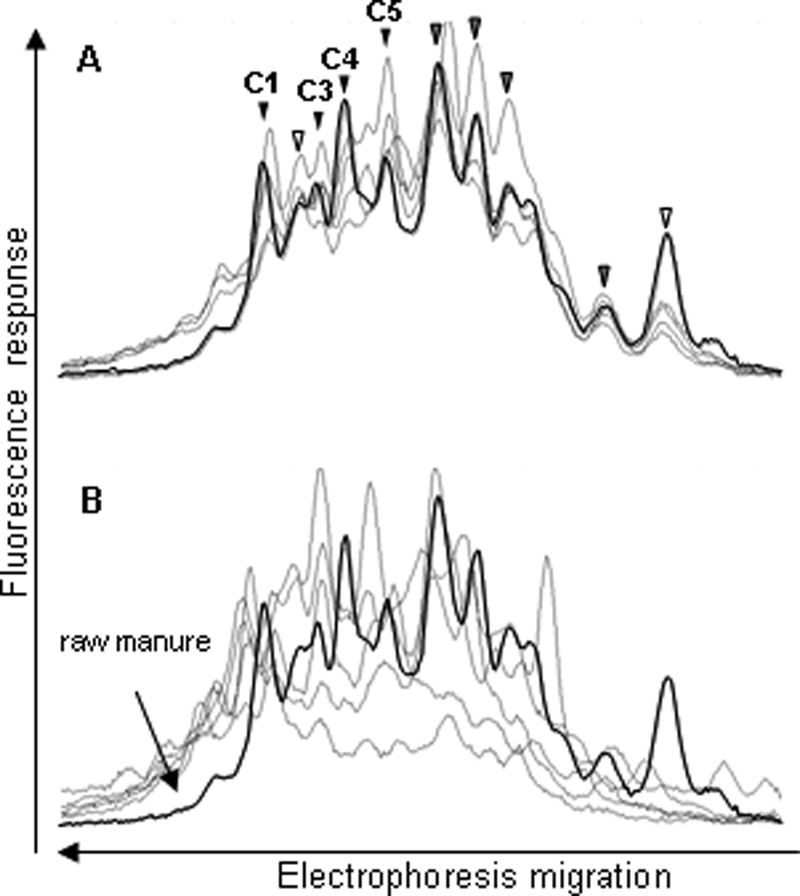
Comparison of the Eubacterium-Clostridiaceae group CE-SSCP profiles from five raw manure samples (A) and five treated manure samples (B). One raw manure profile (in bold) is also shown in panel B for comparison. The peaks corresponding to the dominant bacterial populations are indicated by arrowheads. The white arrows correspond to unidentified peaks, gray arrows to peaks identified by one sequence only, and black arrows to peaks identified by at least two sequences. Peaks that could be identified are designated C1 to C5, as in Table 3.