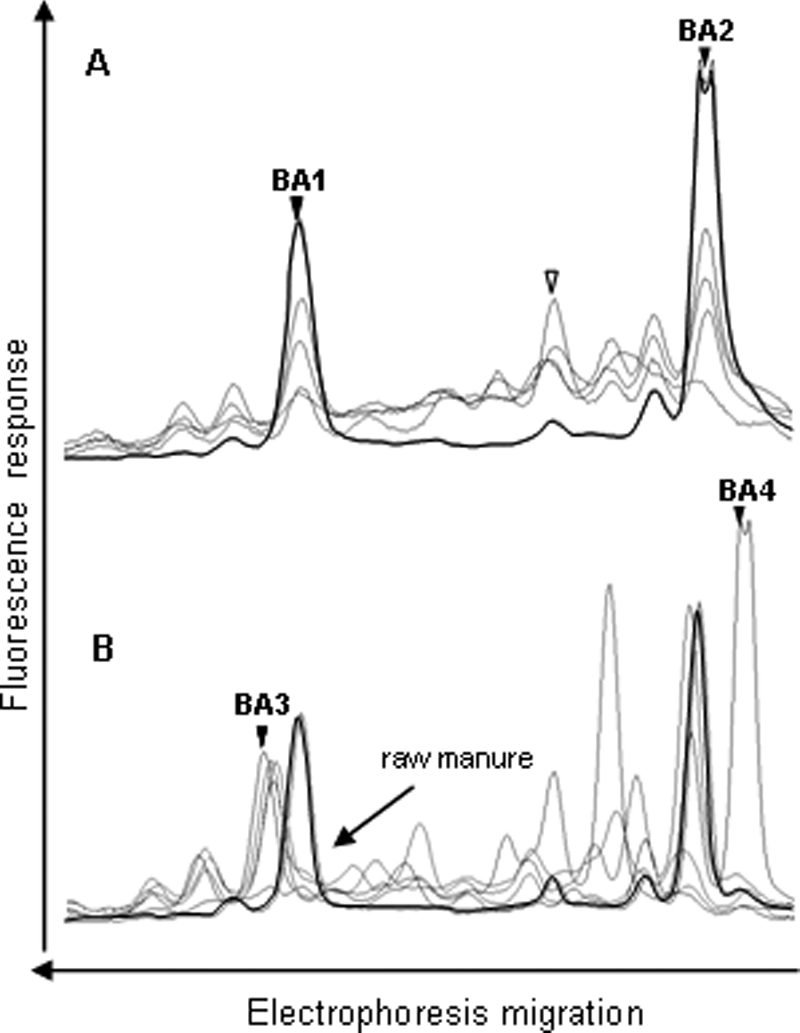
FIG. 3.

Comparison of the Bacteroides-Prevotella group SSCP profiles from five raw manure samples (A) and five treated manure samples (B). The symbols are the same as those in Fig. 1. Peaks that could be identified are designated BA1, BA2, BA3, and BA4 (further characterized in Table 3). Because of their strong dominance over the profiles, peaks BA2 and BA4 saturated the fluorescence detector when other peaks were detectable.
