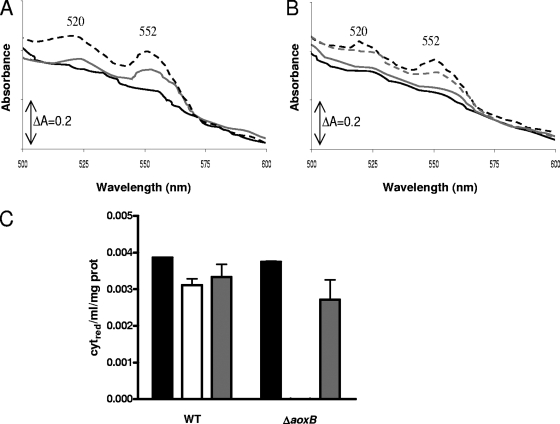
FIG. 5.
Effects of arsenite on cell extracts of O. tritici type strain (A) and mutant O. tritici ΔaoxB (B) containing c-type cytochromes and relative cytochrome c reduction extension per milligram of protein by arsenite in O. tritici wild-type (WT) and O. tritici ΔaoxB mutant cells (C). The black broken line represents the extract at the beginning of the assay, prior to oxidation with ferrocyanide. The black solid line shows the totally oxidized extract, after addition of ferrocyanide and potassium cyanide. The gray line shows the spectrum obtained after addition of 10 mM arsenite. The gray broken line represents the spectrum obtained after full reduction by dithionite and is not shown in panel A, as it superposes with the gray solid line. The relative cytochrome c reduction was determined from the difference between the change in absorbance at 552 and 570 nm [ΔA(552-570)] in the assay and the ΔA(552-570) when totally oxidized by ferrocyanide. The black bar represents cytochrome c reduction at the beginning of the assay; the white bar represents cytochrome c reduction after complete oxidation with ferrocyanide followed by addition of 10 mM As(III); the gray bar represents cytochrome c reduction after addition of sodium dithionite. Results are averages of three independent assays.

