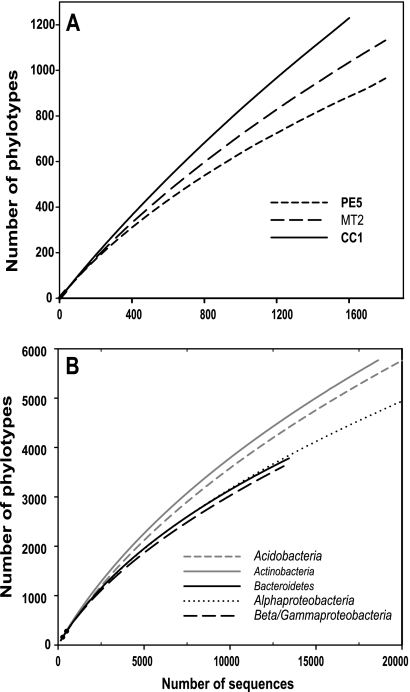
FIG. 1.
(A) Rarefaction results for soils with low (PE5), average (MT2), and high (CC1) levels of diversity. The same three soils were also used for Fig. 3. (B) Rarefaction results for the five dominant bacterial phyla across all soils combined. To make the patterns clear, we have shown rarefaction curves for only the first 20,000 sequences per group. PE5, Manu National Park, Peru, tropical forest soil, pH 3.6; MT2, Missoula, MT, temperate coniferous forest, pH 6.7; CC1, Cedar Creek LTER, United States, temperate grassland, pH 6.0.

