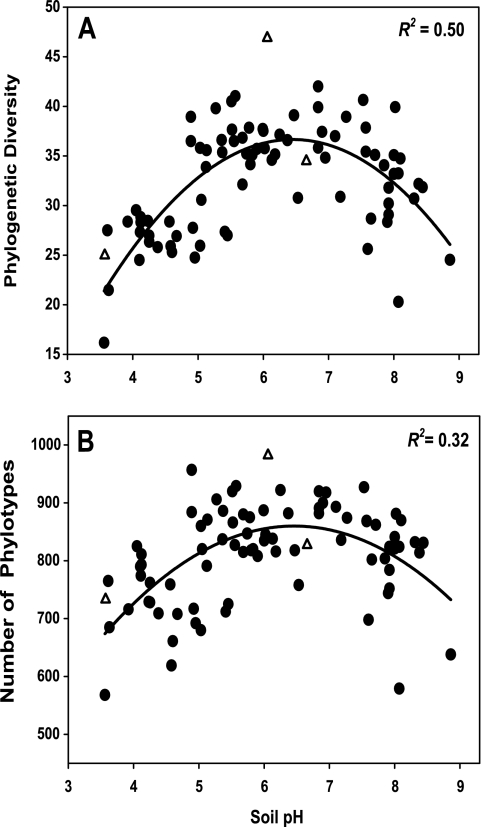
FIG. 3.
Relationship between soil pH and soil bacterial diversity, measuring using Faith's PD (A) and the number of phylotypes (B), with phylotypes defined at the 97% sequence similarity level. Lines represent the best-fit quadratic model to the data. Unfilled triangles represent the three soils shown in Fig. 1A. Diversity indices were calculated using 1,200 sequences per soil sample.

