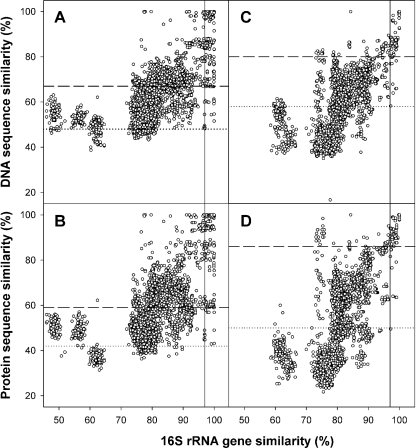
FIG. 1.
Correlation of DNA and in silico-translated amino acid sequence similarities of narG (A, B) and nosZ (C, D) versus 16S rRNA gene similarity. Dotted lines represent the similarity values, below which two sequences always had less than 97% 16S rRNA gene sequence similarity. The dashed lines represent the 90% quantile of pairwise sequence comparisons with a 16S rRNA gene sequence similarity of 97% (i.e., threshold similarity). The solid lines mark the 97% 16S rRNA gene similarities.

