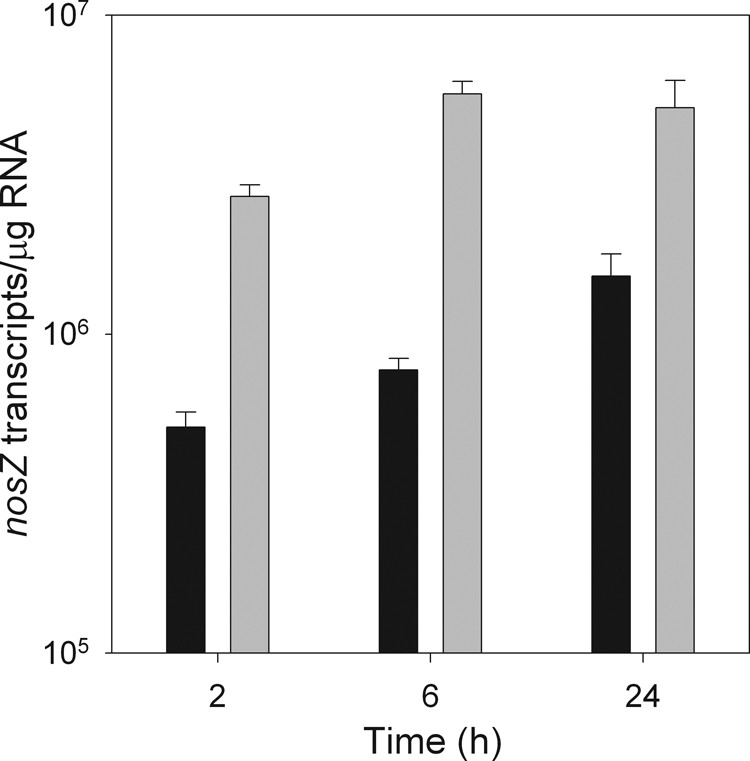
FIG. 4.

nosZ gene expression in P. mandelii grown in TSB medium supplemented with 1,000 mg of KNO3/liter, grown in the presence (▪) or absence (░⃞) of acetylene. Error bars indicate ± 1 SEM (n = 6 for cnorB and nirS and n = 3 for nosZ). Values were calculated from the line of best fit described by the linear equation for cnorB: y = −3.275x + 35.640 (r2 = 0.98) for the first experiment and y = −2.772x + 34.347 (r2 = 0.99) for the second experiment. For nirS, y = −2.648x + 46.202 (r2 = 0.99) for the first experiment and y = −3.014x + 47.619 (r2 = 0.99) for the second experiment. For nosZ, y = −3.799x + 44.825 (r2 = 0.99).
