
Figure 3.
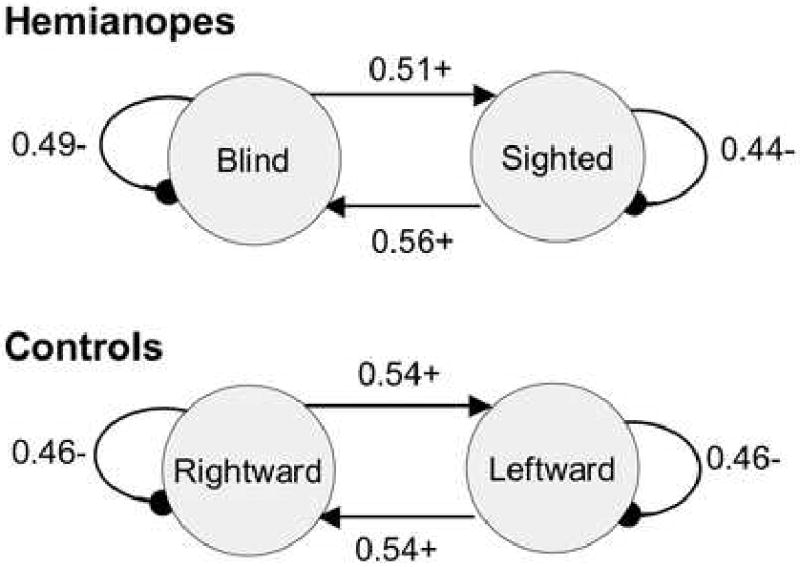
State transition diagrams of saccade direction sequential probabilities, collapsed across subjects within groups. For hemianopes, averages were taken with respect to the blind field rather than right vs. left. A “+” indicates that the transition was more probable that chance, while a “-” indicates that the transition was less probable than chance. A saccade strategy of several hypometric saccades followed by a hypermetric saccade should lead to a higher probability of autotransitions (i.e., a saccade in one direction should be followed by a saccade in the same direction with a high probability). Instead, saccades in one direction are more likely to be followed by saccades in the opposite direction. Each individual subject showed the same pattern, although the transition probability matrix was statistically different from chance in only one hemianope and two controls.