
Figure 4.
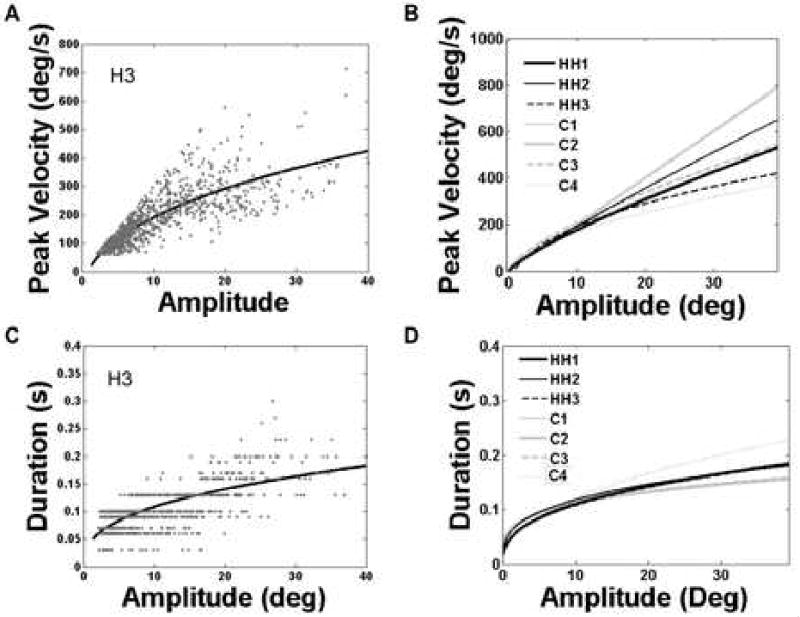
Saccade main sequence data. Fits are based on eye-in-head coordinates. A) Scatter plot of saccade peak velocity-amplitude pairs for a typical hemianopic participant (H1), and the best fitting power function showing the typical curvilinear relationship. B) Power function fits for the peak velocity-amplitude relationship for each participant. Black lines show fits to data from the three hemianopes, while gray indicates lines fit to the control data. The hemianopes clearly fall within the range of control functions, indicating that neither the slope nor exponent parameters were abnormal. C) Scatter plot of the duration-amplitude pairs for H1, and the resulting best-fitting power function. D) Power function fits for the duration-amplitude relationship for each participant. Functions for hemianopes are represented by black lines, those for controls are in gray. Again we see that the hemianopes were well within the range of control participants.