
Figure 5.
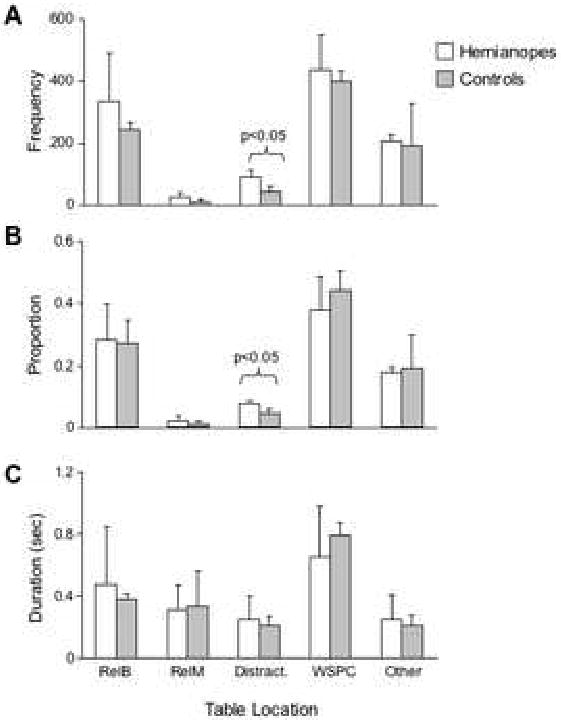
Group means for gaze location statistics, divided by location. Error bars represent two standard errors of the estimate. RB = relevant bin, RM = relevant marker, Dis = distracter, WSPC = workspace, Other = all other possible locations (other parts of the table or laboratory). A) The frequency of fixations to each location, averaged across participants within groups. The hemianopes fixated more frequently on distracter bins. B) The proportion of total fixations at each location, averaged across participants within groups. The hemianopes allocated a greater proportion of their fixations to distracter bins. C) Mean duration of fixations to each location, averaged across participants within groups.