
Figure 6.
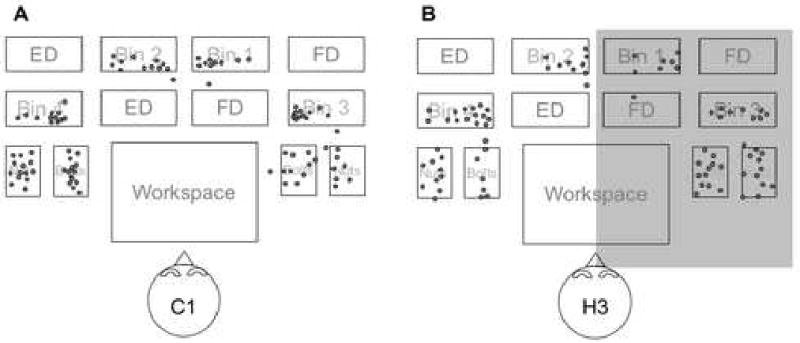
Approximate locations of fixations relative to the table for two typical participants. A) Control participant C1. B) Hemianope H3. The shaded region indicates the side of the blind hemifield. Controls and hemianopes were qualitatively similar in both the accuracy and dispersion of their gaze, and hemianopes demonstrated no consistent bias in their gaze locations. For example, the apparent rightward bias toward Bins 1 and 2 in H3 was not present in the other right-field hemianope.