
Figure 8.
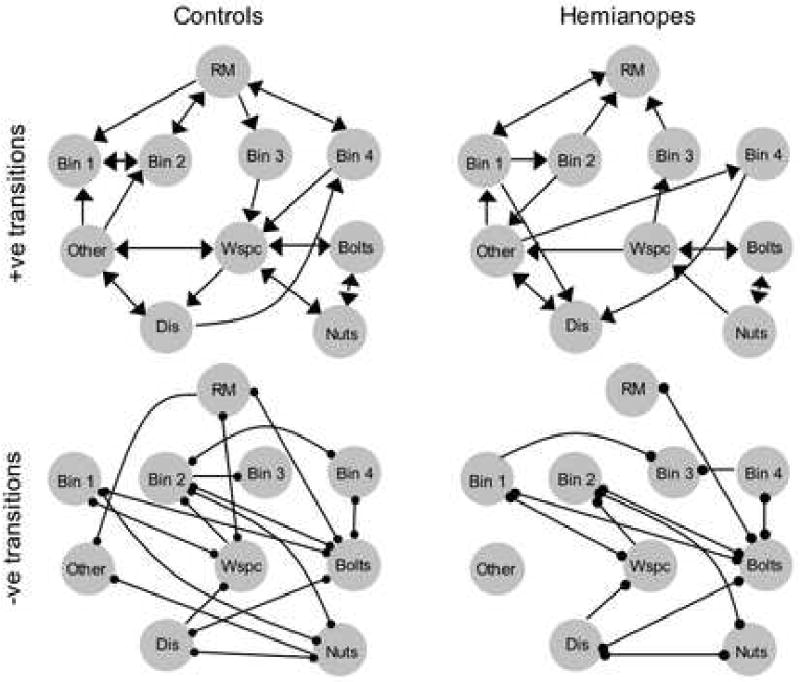
State transition diagrams, collapsed across subjects within groups. For the hemianopes averaging was done without regard to side of deficit. Arrows indicate transitions that are more probable than chance, dots indicate transitions that are less probable than chance. A) Control participants had 24 transitions that were more probable than chance. B) Hemianopes had 19 transitions that were more probable than chance. C) Control participants had 27 transitions that were less probable than chance. D) Hemianopes had 20 transitions that were less probable than chance. RM = relevant marker, WSPS = workspace, Dis = distracter.