
Figure 9.
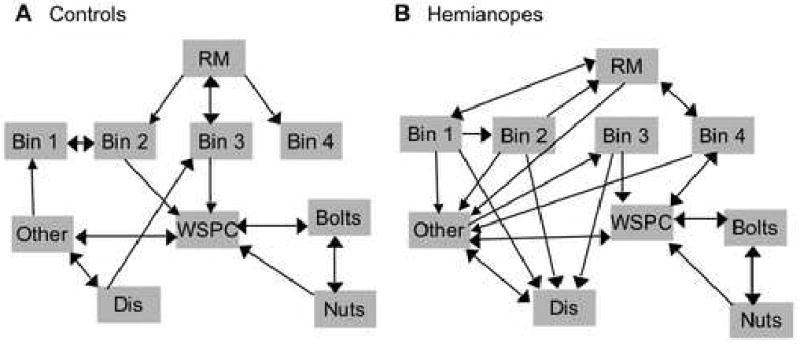
Pathfinder associative network representations of the lag 1 transition probability matrices. A) Control participants have a sparse network compared to the hemianopes, indicating that their gaze was more predictable. B) Hemianopes frequently had an intermediate fixation to some “other” location when returning their gaze to the workspace after a pickup. They also often transitioned their gaze from bins to markers and from relevant bins to distracter bins. RM = relevant marker, WSPS = workspace, Dis = distracter.