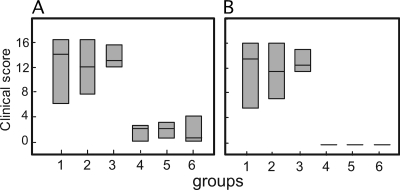
FIG. 3.
Maximum and end point clinical scores of infected animals. (A) Box plot showing the maximum clinical scores recorded for the individual animals. No statistical difference was shown among groups 1, 2, and 3 and among groups 4, 5, and 6. Statistically significant differences are between groups 1 and 3 and groups 4 and 6. (B) Box plot showing the endpoint clinical score recorded at 6 days postchallenge or when the pigs were slaughtered for animal welfare reasons. There was no statistical difference among groups 1, 2, and 3 and among groups 4, 5, and 6. Statistically significant differences were between groups 1 and 3 and groups 4 and 6. The different populations were compared according to the Mann-Whitney rank sum test.

