FIG. 3.
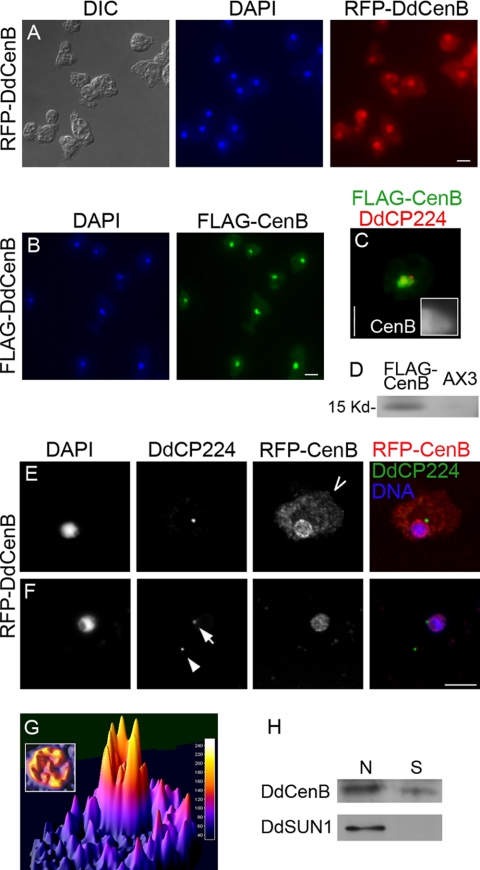
DdCenB localizes to the nucleus but not to the centrosome. Epifluorescence images show cells expressing RFP-DdCenB (A) and FLAG-DdCenB (B). Additionally, cells expressing FLAG-DdCenB were also costained with anti-DdCP224 (C). The inset shows the centrosome region at 3× magnification. (D) Immunoblot of total cell extracts probed with anti-FLAG antibodies. RFP-DdCenB cells (E) and a purified centrosome/nucleus fraction (F) were also observed by confocal microscopy. Images are brightest point projection (E) and a single optical section at the focal plane of the centrosome (F). Cells were fixed with chilled methanol, labeled with antibodies (as indicated), and stained with DAPI. Centrosomes were isolated by differential centrifugation and stained identically to whole cells. The arrow points to a nucleus-attached centrosome and the arrowhead to a “free” centrosome. (G) Three-dimensional plot of fluorescence intensity of a single RFP-DdCenB-expressing cell (taken from panel E; the vantage point is marked with an open arrow). The inset shows the nuclear area viewed from above. (H) Cell fractionation of GFP-DdCenB-expressing cells. GFP-DdSun1 (a NE protein) was used as a control. N, nuclear; S, soluble. Secondary antibodies: anti-mouse Alexa 488 (panels E and F) and anti-rabbit Alexa 568 (panel C). All images are shown at the same magnification. Bars, 5 μm. DIC, differential interference contrast.

