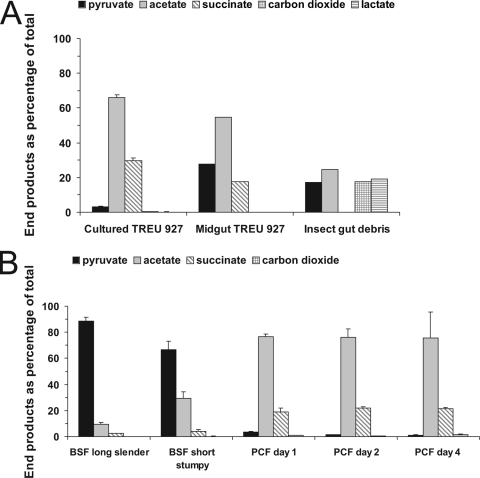
FIG. 1.
Radioactive end products of [6-14C]glucose metabolism of procyclic TREU 927 T. brucei cells grown in vitro or isolated from the midguts of tsetse flies (A) and that of AntAR 1 T. brucei during differentiation of BSF to PCF trypanosomes (B). (A) The results of a single experiment for PCF trypanosomes isolated from the midgut and for insect gut debris and the mean + the standard deviation (SD) of three parallel incubations for in vitro-cultured PCF trypanosomes are shown. Total end product formation from [6-14C]glucose was 2.08 ± 0.19 μmol/h per 108 cells and 0.23 μmol/h per 108 cells for in vitro-cultured and midgut-isolated PCF trypanosomes, respectively, and was calculated using the number of trypanosome cells present at the beginning of the incubation. End product formation in the incubation with PCF trypanosomes isolated from the midgut was corrected for end products produced by contaminating insect gut debris (see text for details). (B) Metabolic incubations using 6-14C-labeled glucose were performed during differentiation from short stumpy BSF trypanosomes to insect stage PCF trypanosomes. Incubations with PCF trypanosomes were started at 24, 48, and 96 h after induction of differentiation (PCF trypanosomes on day 1, PCF trypanosomes on day 2, and PCF trypanosomes on day 4, respectively); means + SDs of three parallel incubations are shown (for the short stumpy form, six incubations in two independent experiments). Total glucose consumption in incubations with long slender BSF trypanosomes, short stumpy BSF trypanosomes, PCF trypanosomes on day 1, PCF trypanosomes on day 2, and PCF trypanosomes on day 4 was 4.8, 3.4, 1.5, 1.1, and 0.79 μmol/h per 108 cells, respectively. Excreted labeled end products shown in panels A and B were analyzed as described previously (25) and are expressed as the percentage of the total amount of radioactive end products produced (in the incubation of gut debris, one other unidentified end product was produced, which explains why this total in the figure does not add up to 100%). The decrease in pyruvate production between long slender and short stumpy BSF trypanosomes as well as the increase in acetate production is significant as calculated using an unpaired t test (P < 0.01 for pyruvate and P < 0.001 for acetate).

