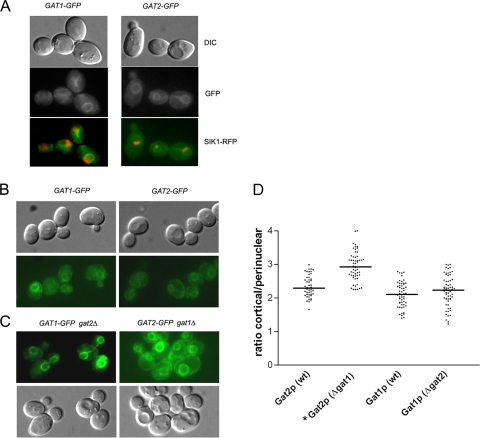
FIG. 2.
Gat1p and Gat2p are localized to the ER. Live imaging of endogenous levels of Gat1-GFP and Gat2-GFP in exponentially growing cells. (A) Perinuclear ER localization of Gat1p and Gat2p (green) is observed in cells coexpressing the nucleolus marker Sik1-RFP (red). DIC, differential interference contrast images. (B and C) GAT1-GFP GAT2 and GAT2-GFP GAT1 (wild-type background) (B) or GAT1-GFP gat2Δ and GAT2-GFP gat1Δ (C) strains. Images were obtained using the same exposure time to allow for comparison of the pictures. (D) Cortical/perinuclear ratio distribution of Gat1-GFP or Gat2-GFP in the wild type (wt) versus that in the gat single mutants. Central horizontal lines correspond to the medians. The asterisk in the distribution of Gat2-GFP (Δgat1) denotes a significantly (P < 0.001) different distribution than that of the wild type (Dunnett's test, n ≥ 60).

