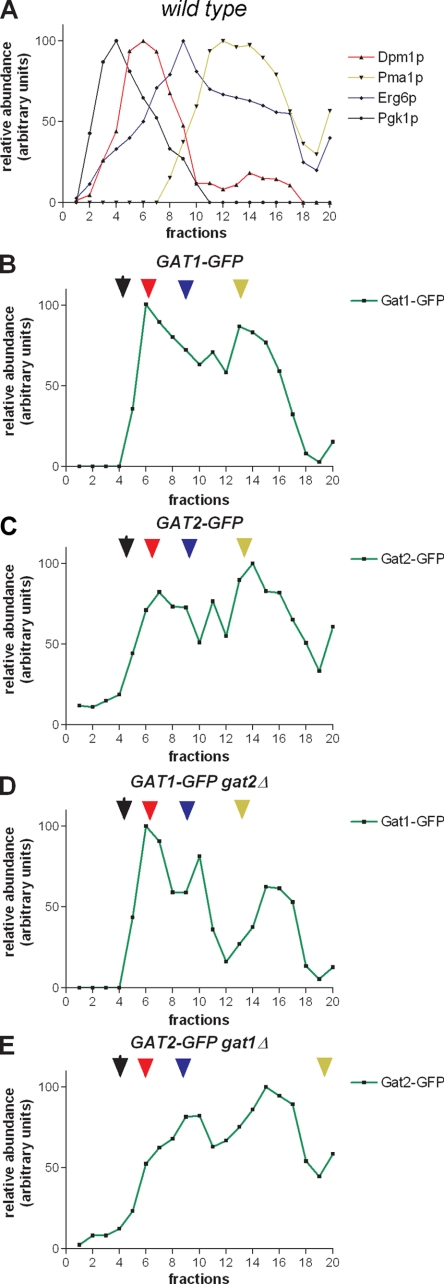
FIG. 3.
Subcellular fractionation of Gat1p and Gat2p. The same strains shown in Fig. 2B and C expressing endogenous levels of Gat1-GFP or Gat2-GFP (in the wild type or gat single-knockout mutants) were grown to mid-exponential phase in liquid culture. Cells were spheroplasted, and subcellular fractionation was performed, as indicated in Materials and Methods, using sucrose density gradients. Equilibrium distribution of Pgk1p (cytosol, black), Dpm1p (ER, red), Erg6p (ER/lipid particle, blue), and Pma1p (PM, orange) in an isogenic wild-type strain. (A) was similar in all GFP strains analyzed (B to E), except for Pma1p in gat1Δ (E). Densitometry of the blots obtained for each protein was performed, and the amount per fraction was expressed relative to the value obtained for its respective peak. A representative experiment of four performed under similar conditions is shown. Corresponding blots are shown in Fig. S1 in the supplemental material.

