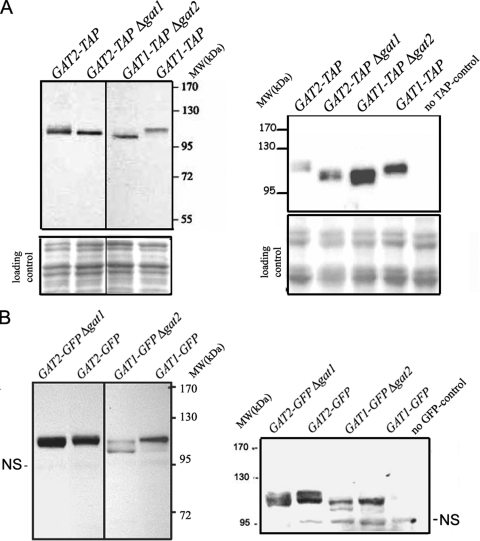
FIG. 4.
Cells compensate for GPAT deficit. Analysis of endogenous Gat1p and Gat2p levels in exponentially grown wild-type or gat single-knockout strains. (A) TAP-tagged strains were lysed (see Materials and Methods), and 25 μg total protein samples were loaded onto an 8% denaturing gel and then subjected to Western blot analysis using rabbit immunoglobulin G (to recognize the protein A moiety of the TAP tag). The loading controls shown correspond to the same membranes stained with Ponceau red after protein transfer. MW, molecular weight. (B) Alternatively, GFP-tagged strains shown in Fig. 2 and 3 (50 μg total protein) were blotted with a monoclonal anti-GFP antibody. The nonspecific band (NS) serves as the loading control. The same samples used in on the left in panels A and B were loaded in a parallel gel that was run for an extra 30 min to allow further separation and visualization of the multiple bands present in each sample. It is worth noting that the appearance of multiple bands and that the migration shift observed in the single-knockout strains, regardless of the tag, compared to those of wild-type cells for both Gat1p and Gat2p. Gat1p predicted molecular mass, 83.6 kDa; Gat1-TAP, ∼104 kDa; Gat1-GFP, ∼114 kDa; Gat2p, 85.7; Gat2-TAP, ∼106 kDa; Gat2-GFP, ∼116 kDa.

