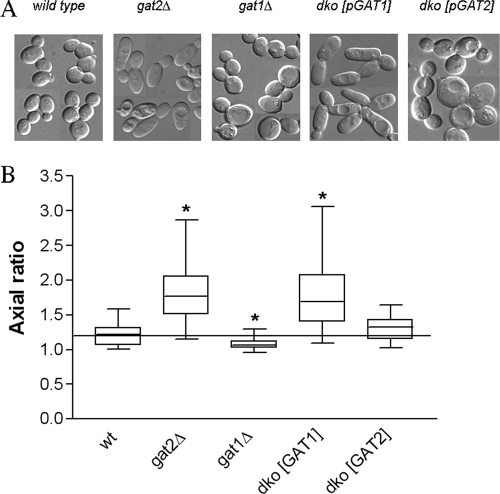
FIG. 7.
Differential contribution of Gat1p and Gat2p to polarized cell growth. (A) Transmission images showing the cell morphology of double-knockout strains dko-GAT1 and dko-GAT2 as well as the gat1Δ and gat2Δ single-deletion strains and their isogenic wild type (W303). At least 50 cells from each strain were processed, as indicated in Materials and Methods, to measure cell length and width. (B) Box plot of the axial ratio distributions. The box plot shows the medians (central horizontal line) with the 25th and 75th percentiles (box). The bottom line coming out of the box ends at the 5th percentile, whereas the top one ends at the 95th percentile. An asterisk denotes significantly (P < 0.001) different distribution than that of the wild type (wt) (Dunnett's test, n ≥ 50).

