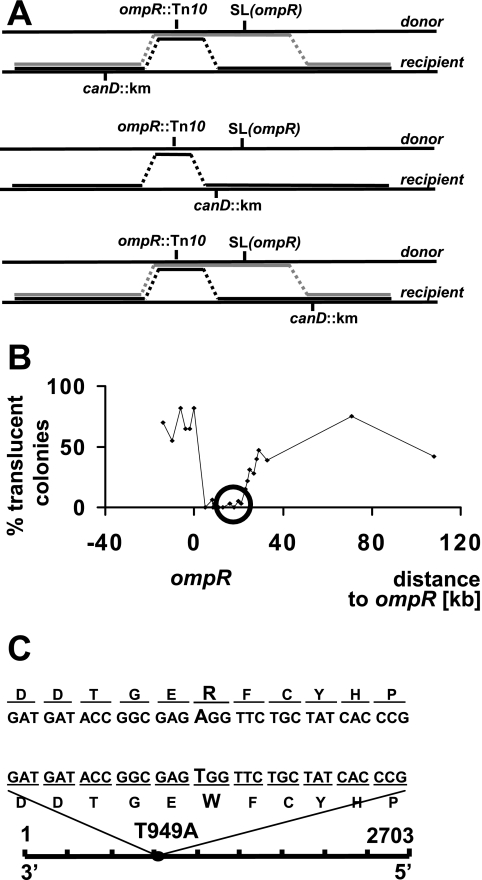
FIG. 3.
Mapping of malT(Con)(T949A) by P1 transduction. (A) Mapping strategy. The ompR allele was transduced into strains carrying mutant genes (designated canD) spanning the ompR SLompR region. Depending on the relative locations of ompR, SLompR, and canD, the frequency of translucent colonies varies. Black lines indicate crossover events that do not yield translucent colonies (i.e., result in an ompR mutant). Gray lines indicate crossover events that give rise to translucent colonies (i.e., result in an ompR SLompR double mutant). (B) Frequency of translucent colonies after transduction of ompR into canD mutants. After transduction, translucent and nontranslucent colonies were counted, and the percentage of translucent colonies was calculated and plotted. The x axis shows the distance of canD genes and the mal-rtc locus (circled) relative to ompR. At least 80 colonies were tested for each transduction. (C) Location of SLompR. The 2,703-nucleotide DNA sequence of malT and the approximate position of the malT(Con)(T949A) mutation (circle) are shown in the lower part of the panel. The enlargement in the upper part of the panel shows the nucleotide and amino acid changes corresponding to the malT(Con)(T949A) mutation.

