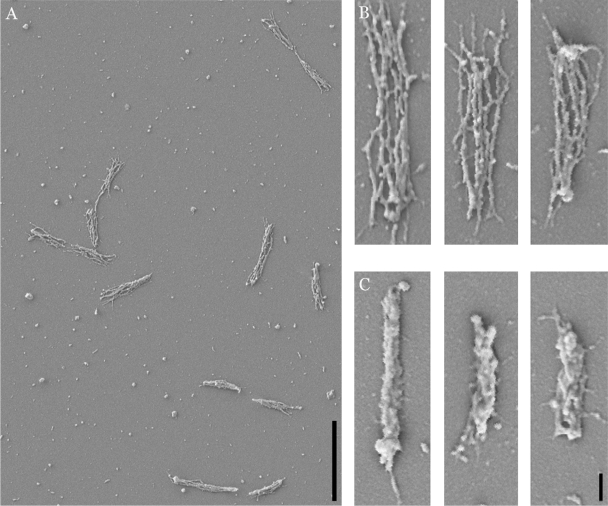
FIG. 3.
Scanning electron micrographs of M. insons attached to glass coverslips and extracted with TX. (A) Low-magnification view of cells extracted with 3.2% TX. (B) High-magnification view of three separate cells extracted with 3.2% TX. (C) High-magnification view of three separate cells extracted with 1.2% TX. Bars: panel A, 2 μm; panel C, 200 nm; magnification of panel B is the same as for panel C.

