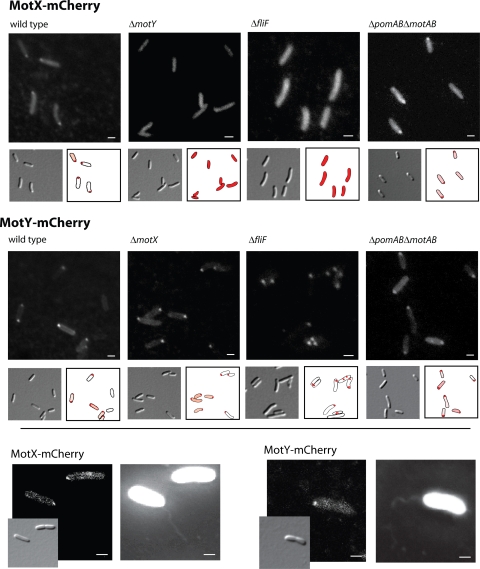
FIG. 3.
Localization of MotX-mCherry and MotY-mCherry in S. oneidensis MR-1. Displayed are DIC and fluorescence micrographs of cells harboring motX-mCherry (upper panel) and motY-mCherry (middle panel) in the wild type, ΔmotY or ΔmotX, ΔfliF, and ΔpomAB ΔmotAB mutant backgrounds (from left to right). To facilitate the visualization, the position of fluorescence signals relative to that of the cells is displayed. The lower panel shows colocalization of the flagellar filament with MotX-mCherry (left) and MotY-mCherry (right). DIC and fluorescence micrographs are displayed. Scale bars, 1 μm.

