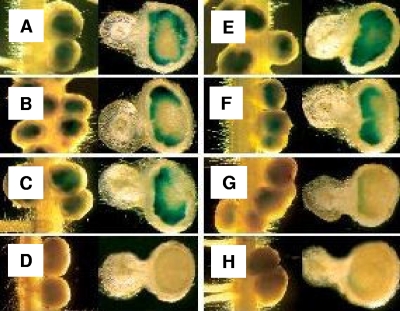
FIG. 3.
Expression of dctAp (A to D) and kgtPp (E to H) during nodulation. Analysis of β-galactosidase activity was done 10 days postinfection. Images shown in each frame are of whole nodules on the left, and images on the right show internal regions after cross-sections of these nodules. Nodules were induced by CIAT899 (A and E), GA1 (B and F), GA11 (C and G), and GA12 (D and H).

