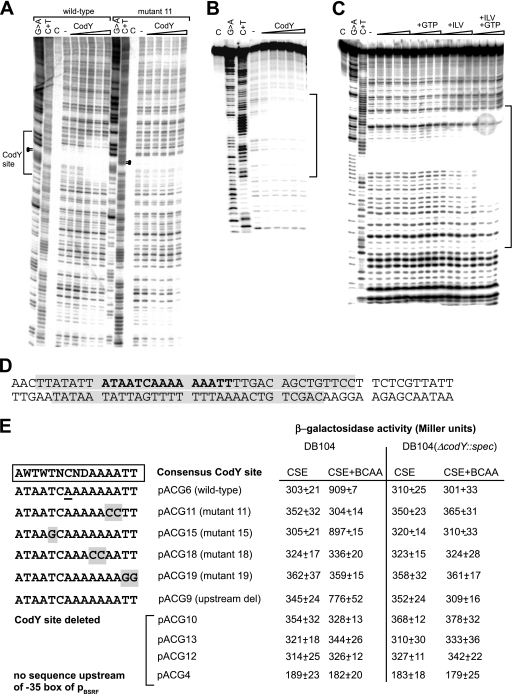
FIG. 8.
Interaction of CodY with the bsrF promoter region. (A and B) DNase I footprinting analysis of the interaction of CodY and the bsrF promoter. DNase I footprinting with increasing amounts of purified CodY-His6 (1.0 μM, 1.4 μM, 1.8 μM, 2.2 μM, and 2.6 μM) (indicated by triangles) was performed in the presence of 2 mM GTP and 10 mM BCAA as described in Materials and Methods. Lane C, control without DNase; lane −, control with DNase but without CodY. The binding site is indicated. (A) Coding strand DNA fragment comprising nt 1 to 176 (Fig. 5C). Dots indicate residues replaced in mutant 11. (B) Noncoding strand (DNA fragment comprising nt 57 to 145 [see Fig. 5C]). (C) Analysis in the presence and absence of CodY, BCAA, and GTP (DNA fragment as in panel B). The triangles indicate increasing amounts of CodY (as described above for panel A). The bracket indicates the region protected by CodY. (D) Sequences on the coding and noncoding strands examined. Protected regions are shaded. The predicted CodY consensus binding site is indicated by bold type. (E) Overview of the mutants with mutations in the CodY binding site. Mutated nucleotides are shaded. The corresponding pACG derivatives and the measured β-galactosidase activities are indicated on the right. Mutated pACG derivatives pACG11, pACG15, pACG18, and pACG19 contain the same region upstream of the CodY site as pACG6, whereas pACG9, pACG10, pACG12, pACG13, and pACG4 contain shortened upstream regions (see Fig. 6). For measurement of β-galactosidase activity, B. subtilis strains were grown in CSE medium with 0.1% glucose with or without BCAA (as indicated) until the OD600 was 0.3. All of the values are averages of at least three independent determinations with five different integrants.

