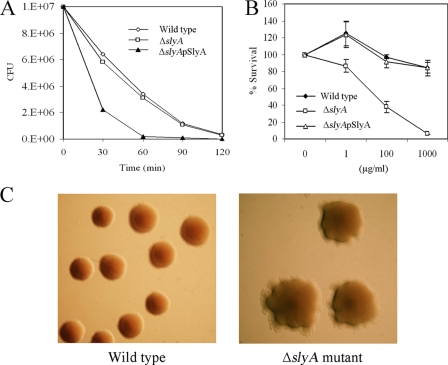
FIG. 3.
Sensitivity tests. (A) Sensitivities of the different bacterial strains to H2O2. The data represent one of three separate experiments, which gave similar results. (B) Sensitivity to polymyxin B, showing the mean and standard deviation of five separate experiments. (C) Colony morphologies of the wild type and the ΔslyA mutant after exposure to hydrogen peroxide. The photographs represent one of three separate experiments, which gave similar results.

