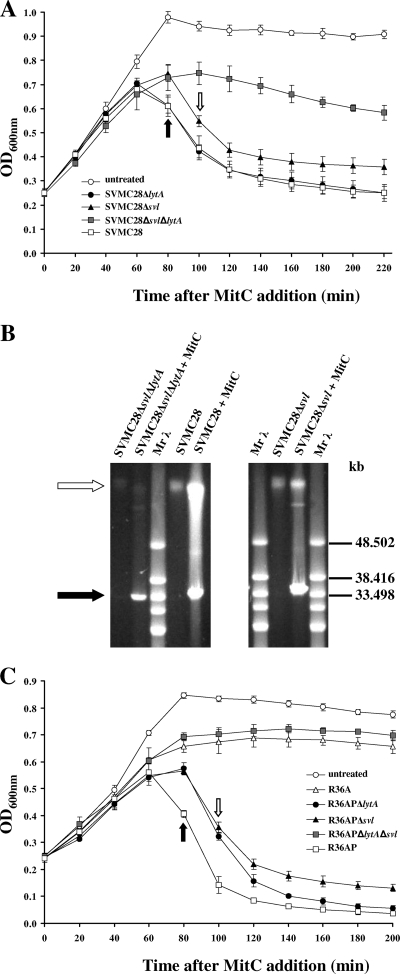
FIG. 1.
Participation of bacterial and phage lysins in pneumococcal-phage-induced lysis. (A) Lysis profiles of SVMC28 strains. Wild-type SVMC28 and the derived mutants were grown to an OD600 of 0.2 to 0.25, and 0.1 μg/ml of MitC was added to induce phage excision (0 min). (B) PFGE analysis of extrachromosomal phage DNA induced with MitC. Total DNA was isolated from cultures of SVMC28, SVMC28 Δsvl, and SVMC28 Δsvl ΔlytA treated with MitC or left untreated (control). The preparations were separated by PFGE. The white arrow indicates the bacterial chromosome (about 2.2.Mb), while the black arrow indicates phage DNA. Similar PFGE profiles were obtained for SVMC28 ΔlytA (data not shown). Mrλ, lambda ladder PFGE marker (New England Biolabs, Beverly, MA). (C) Lysis profiles of lysogenized R36A strains. R36AP, R36AP ΔlytA, R36AP Δsvl, and R36AP ΔlytA Δsvl were grown to an OD600 of 0.2 to 0.25, and 0.1 μg/ml of MitC was added to induce phage excision (0 min). In panels A and C, the arrows represent the times at which lysis started: 80 min after MitC addition for SVMC28, SVMC28 ΔlytA, and R36AP (black arrows) and 100 min for SVMC28 Δsvl, R36AP Δsvl, and R36AP ΔlytA (white arrows). The untreated SVMC28 and R36AP cultures are representative of the growth curves of all untreated strains. The results are averages of a minimum of four independent experiments, and 95% confidence intervals are indicated.

