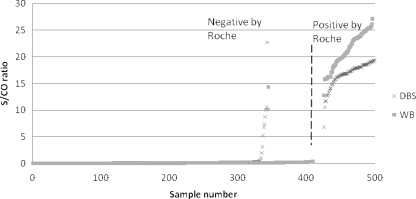
FIG. 1.
Scatter plot of the results for the WB and DBS samples for comparison of the Aptima assay and the Roche Amplicor assay results. The vertical axis is the S/CO ratio value from the Tigris platform, and the horizontal axis is the sample number sorted by samples with reactive and nonreactive results reported by the Roche Amplicor assay. The vertical line separates samples found to be negative and positive by the Roche Amplicor HIV-1 DNA assay. Two WB samples were reactive (S/CO ratio, >1) by the Aptima assay but nonreactive by the Roche Amplicor assay, with S/CO ratio values of <15. Ten DBSs were reactive by the Aptima HIV-1 assay and nonreactive by the Roche Amplicor assay. One sample had an S/CO ratio value of 22.75, and the remaining nine samples had S/CO ratio values of ≤10. The values for these samples obtained upon repeat testing are also shown in Table 2.

