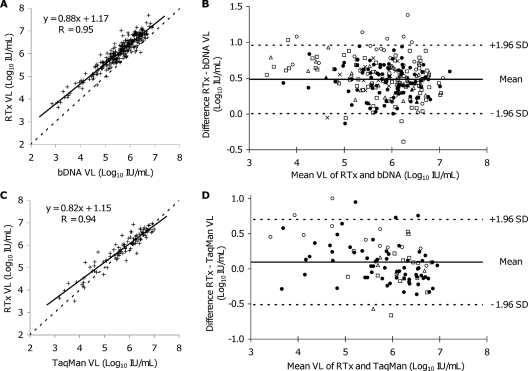
FIG. 3.
Comparisons of small-volume RTx assay results to bDNA and TaqMan results for clinical serum and plasma specimens for quantification of HCV RNA. (A) Linear regression analysis of the small-volume RTx assay versus the bDNA assay for 273 specimens. (B) Bland-Altman plot of paired VL differences between the small-volume RTx assay and the bDNA assay. (C) Linear regression analysis of the small-volume RTx assay versus the TaqMan assay for 98 specimens. (D) Bland-Altman plot of paired VL differences between the small-volume RTx and TaqMan assay VLs. HCV genotypes in panels B and D are indicated by the following symbols: •, genotype 1; ▵, genotype 2; ○, genotype 3; ×, genotype 4; ▴, genotype 5; ▪, genotype 6; □, genotype unspecified.

