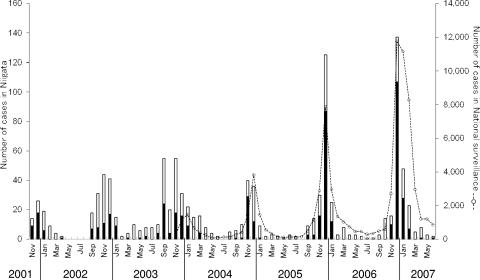
FIG. 1.
Comparison of monthly number of HRSV cases between a hospital-based survey in Niigata and national surveillance in Japan. The monthly distribution of numbers of screened cases in hospital-based surveillance of HRSV in Niigata City is shown by the stacked bar graph; closed boxes indicate numbers of PCR-positive samples, and open boxes denote PCR-negative samples. The numbers of cases in national surveillance of HRSV in Japan are shown by the line graph.

