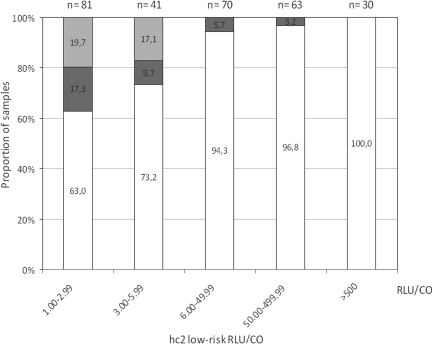
FIG. 1.
The relationship between the proportion of hc2 false reactivity and hc2 RLU/CO values. The light gray part of each bar represents the percentage of hc2 false-positive results due to the absence of HPV DNA, the dark gray part the percentage of hc2 false-positive results due to cross-reactivity with untargeted high-risk HPV genotypes, and the white part the percentage of hc2 true-positive results.

