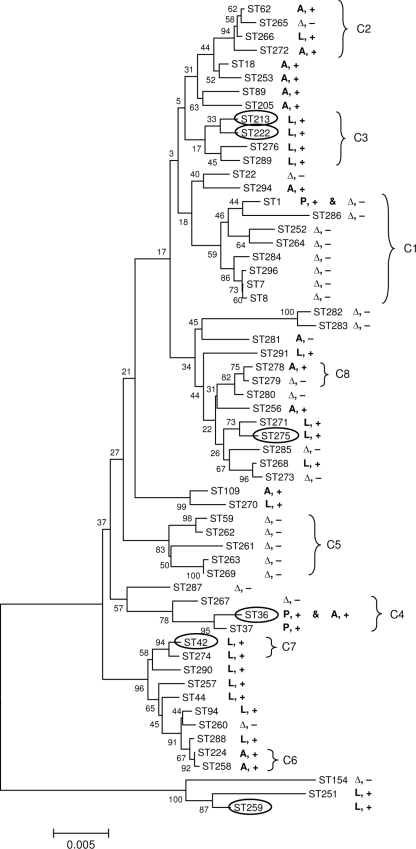
FIG. 4.
Correlations between STs, presence of lag-1, and reactivity with MAb2. The evolutionary relationships between STs were inferred using the neighbor-joining method. The optimal tree is shown. The percentages of replicate trees in which the associated STs clustered together in the bootstrap test are shown next to the branches. The tree is drawn to scale, with branch lengths in the same units as those of the evolutionary distances used to infer the phylogenetic tree. The evolutionary distances are in the units of the number of base substitutions per site. The allele type of the lag-1 gene of the strains within each ST is indicated as A (Arizona), L (Lens), or P (Philadelphia). Δ, lag-1 gene was missing; +, reactivity with MAb2; −, failure to react with MAb2. STs of strains isolated from outbreaks are in ovals. Correlation with clonal complexes (C1 to C8) identified by eBURST analysis is indicated by brackets.

