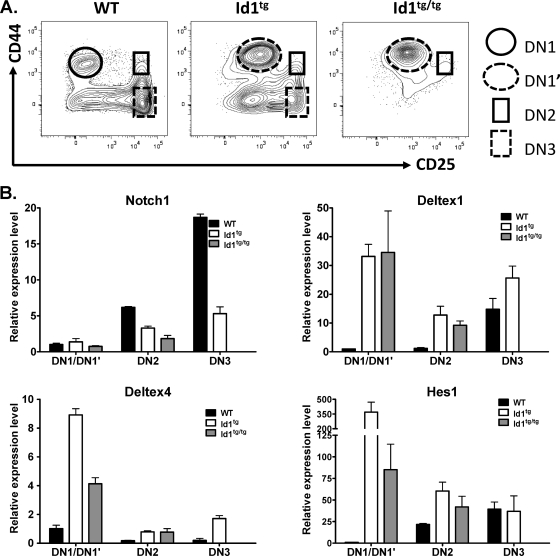
FIG. 3.
Analysis of gene expression. (A) Illustration of cell populations from wild-type, Id1tg, and Id1tg/tg mice that were used for real-time RT-PCR assay. (B) The expression levels of indicated genes by purified DN subsets. Levels of transcripts were normalized against the level of β-actin by calculating ΔCT, where CT is the threshold cycle. Expression levels relative to those of wild-type DN1 cells were determined by using the 2−ΔΔCT formula. Data show the averages ± standard deviations, which were calculated as described previously (10). WT, wild type.

