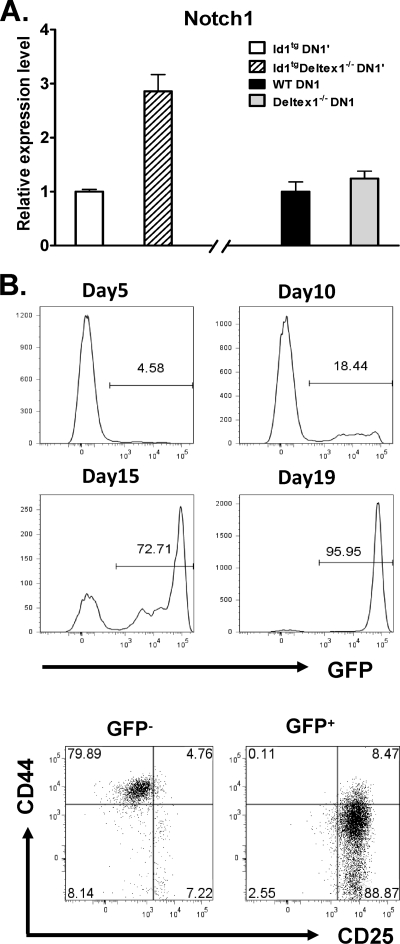
FIG. 6.
Notch signaling potentiates differentiation of DN1′ cells. (A) DN1′ cells from Id1tg and Id1tg Deltex1−/− mice or DN1 cells from wild-type (WT) and Deltex1−/− mice were isolated by cell sorting and used to analyze Notch1 expression. The level of Notch1 mRNA was determined by using real-time RT-PCR and normalized against the level of β-actin mRNA. Data are presented as the relative levels of expression in Id1tg DN1′ or wild-type DN1 cells in the absence or presence of Deltex1 and are shown as averages ± standard deviations from triplicates. The data are representative of two separate experi- ments. (B) DN1′ cells, sorted from Id1tg/tg mice, were transduced with the retrovirus encoding Notch1-IC and GFP. The cells were then plated onto a 24-well plate containing OP9 stromal cells and cultured in medium supplemented with 1 ng/ml of IL-7 and 5 ng/ml of Flt-3L. At different time points of the culture, GFP expression was analyzed, and the percentages of live, GFP+ cells are shown in the histograms. Cells from day-19 cultures were stained with antibodies against CD44 and CD25 and analyzed by gating on live, GFP− and GFP+ populations. Numbers indicate percentage of cells in each quadrant. Data are representative of at least two independent experiments.

