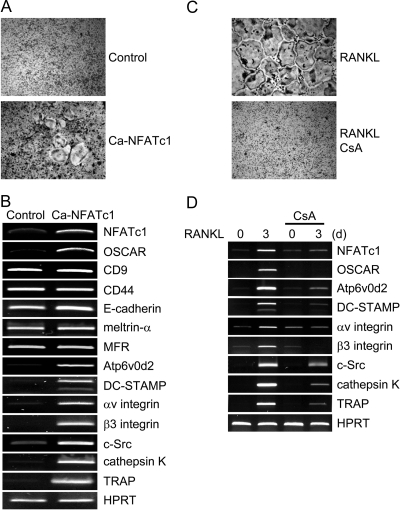
Figure 2.
The Effect of NFATc1 on Expression of Various Genes in Osteoclasts
A and B, BMMs were transduced with pMX-IRES-EGFP (control) or Ca-NFATc1 retroviruses and cultured for 6 d with M-CSF alone. A, Cultured cells were fixed and stained for TRAP. B, RT-PCR was performed to detect expression of the indicated genes. C and D, BMMs were cultured for 3 d with M-CSF and RANKL in the absence or presence of CsA (1 μg/ml). C, Cultured cells were fixed and stained for TRAP. D, Total RNA was collected at the indicated time points. RT-PCR was performed to detect the indicated genes.

