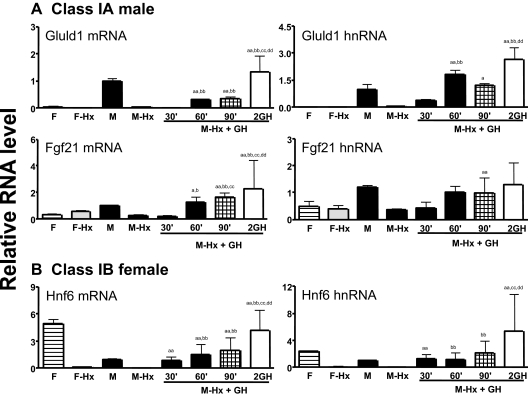
Figure 1.
qPCR Analysis of Class I Sex-Specific Genes Induced by Short-Term GH Treatment
Liver RNA samples were prepared from the liver of the following groups of rats: untreated males (M, n = 8); Hypox males (M-Hx, n = 6); Hypox males treated with a single GH injection and killed after 30 min (M-Hx+GH, 30′, n = 2), 60 min (M-Hx+GH, 60′, n = 3), and 90 min (M-Hx+GH, 90′, n = 3); Hypox males killed 1 h after a second GH injection given 3–4 h after the first injection (M-Hx+2GH, n = 3), untreated females (F, n = 7), and Hypox females (F-Hx, n = 7). RNAs were reverse transcribed to cDNA and assayed for the indicated mRNAs and hnRNAs by qPCR using primers shown in supplemental Table S1. Data shown are mean ± sd values (analysis of pooled RNA from UT male and female and Hypox male and female liver RNAs) or mean ± se values (analysis of individual liver RNAs prepared from Hypox rats treated with GH). Data were normalized to the 18S RNA content of each pooled cDNA sample, with the UT male group set at a value of 1. For M-Hx + GH (30′, 60′, 90′, and 2GH) vs. M-Hx: a, P < 0.05; and aa, P < 0.01; for M-Hx + GH (60′, 90′ and 2GH) vs. M-Hx + GH (30′): b, P < 0.05; and bb, P < 0.01; for M-Hx + GH (90′ and 2GH) vs. M-Hx + GH (60′): c, P < 0.05; and cc, P < 0.01; for M-Hx + 2GH vs. M-Hx + GH (90′): d, P < 0.05; and dd, P < 0.01.

