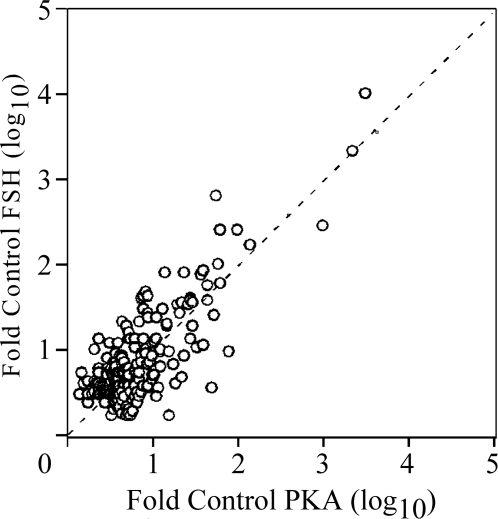
Figure 8.
Microarray Analysis of FSH- and PKA-CQR-Stimulated Gene Expression
Total RNA samples obtained from the experiment presented in Fig. 6 were analyzed with the Illumina Rat-Ref-12 Expression BeadChip array as described in Materials and Methods. Output data from the Illumina microarray readout were analyzed by the ArrayAssist software at a P < 0.005 level of significance. Each data point represents the relative stimulation (fold over control) of individual transcripts that were increased to levels of at least 3-fold over control after FSH (y-axis) and PKA-CQR (x-axis) stimulation for 48 h based upon triplicate samples from cells infected with the PKA-CQR mutant lentivirus at MOI of 5 or stimulated by FSH (100 ng/ml) compared with unstimulated cells as described in Materials and Methods. All medium contained 30 ng/ml testosterone. The dashed line indicates equivalent stimulation by FSH and PKA-CQR. Note that the x- and y-axes are log10 scale.

