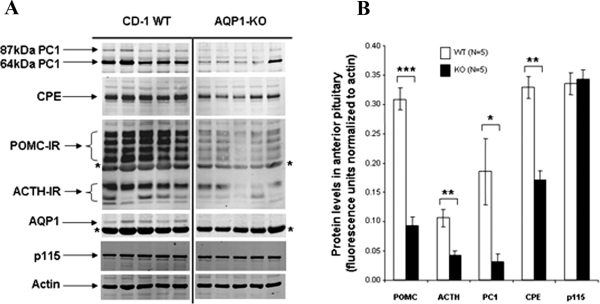
Figure 8.
Analysis of WT and AQP1 KO Pituitary
A, Western blot analysis of five WT (left) and five AQP1 KO (right) soluble extracts of the anterior lobe (AL) of the pituitary. The extracts were probed for POMC/ACTH, PC1/3, and CPE as markers of DCSGs. As controls, the levels of actin, p115, and AQP1 were analyzed. Note the absence of AQP1 in the KO extracts and the overall reduction in the levels of PC1/3, CPE, and ACTH in the KO animals. POMC-IR represents the differentially glycosylated full POMC (32–36 kDa) and its biosynthetic intermediate (22–24 kDa). ACTH-IR represents the glycosylated ACTH (13–14 kDa) and nonglycosylated ACTH (∼4.3 kDa). *, Nonspecific staining of the large amount of GH normally found in AL extracts. B, Bar graphs represent the quantification of the amounts of each protein from the Western blot of the AL extracts. Each protein within each lane was quantified on the Odyssey infrared imaging system and normalized to actin within that lane. The average ± sem of the ratios are plotted for each protein. *, P < 0.05; **, P < 0.01; ***, P < 0.001, Student’s t test.

