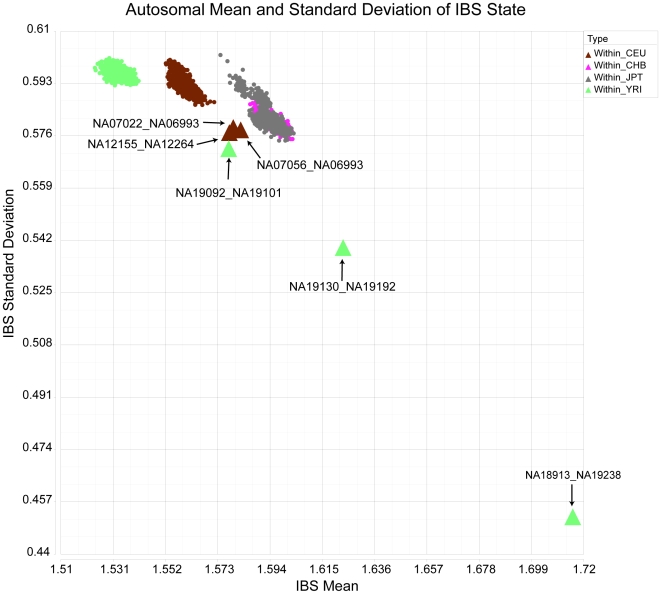
Figure 5. Unspecified relationships in phase 1 / 2 HapMap.
Autosomal mean (x-axis) and standard deviation (y-axis) of IBS state data for the Affymetrix 500K platform visualized for all within group comparisons of a HapMap data set. Each data point corresponds to a pairwise comparison by a locally modified SNPduo. The six comparisons between related individuals are indicated as large triangles and annotated by name.

