Figure 1.
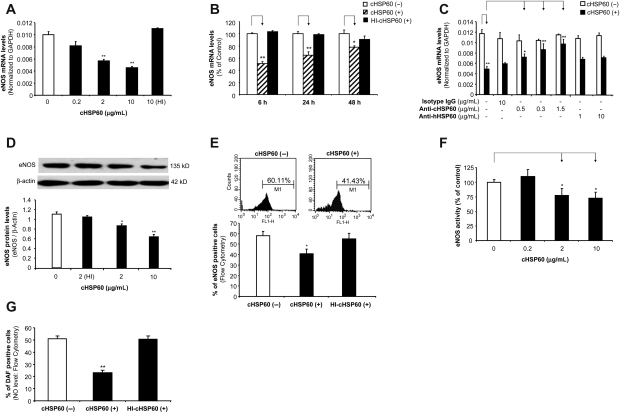
Effects of cHSP60 on eNOS mRNA and protein levels, enzyme activity, and cellular NO levels in HCAECs. Cells were treated with cHSP60 or HI-cHSP60 for 24 h. (A) Real-time PCR (eNOS mRNA in a concentration-dependent study). HCAECs were treated with cHSP60 (0, 0.2, 2, or 10 µg/mL) or HI-cHSP60 (10 µg/mL) for 24 h. (B) Real-time PCR (eNOS mRNA in a time course study). HCAECs were treated with cHSP60 (2 µg/mL) or HI-cHSP60 (10 µg/mL) for 6, 24, or 48 h. (C) Real-time PCR (eNOS mRNA in antibody blocking study). HCAECs were treated with cHSP60 (2 µg/mL) with or without anti-cHSP60 antibody (0.15, 0.3, or 1.5 µg/mL), anti-human HSP60 antibody (1 or 10 µg/mL) or isotype IgG (10 µg/mL) for 24 h. (D) Western blot analysis. Representative bands of eNOS and β-actin western blot staining are shown. Quantitative band density ratios were calculated and showed difference between cHSP60-treated and control groups. (E) Representative histograms of flow cytometry assay of eNOS staining are shown. Average percentage of eNOS positive cells was calculated and shown. (F) eNOS activity assay. (G) Cellular NO levels determined by DAF-FM DA staining and flow cytometry analysis. *P < 0.05, **P < 0.01, n = 3, t-test.

