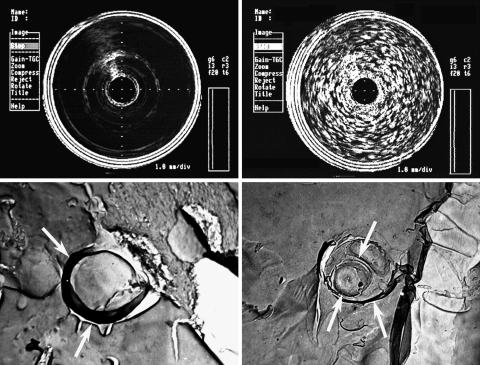
Figure 3.
(Top) Intravascular ultrasound images of 0.1 M phosphate buffer (left; control) and highly echogenic liposomes (right; 10 mg lipid/mL buffer) in a 10 mL glass vial. (Bottom) Freeze fracture electron microscopy of a liposome formulation that is poorly acoustically active (left) and highly acoustically active (right). Note the spheres within the acoustically active formulation vs. the single outer layer of the non-acoustically active formulation. Arrows point to the membrane.

